
| atk > documentation > help > attack visualizing | Last update: 2004/11/02 by Marc Ruef |
Attack Visualizing
One of the important features of the Attack Tool Kit (ATK) is the real-time observation of the detection and attack routines. A very useful feature is the Attack Visualizing where the running procedure is shown graphically.
The Attack Visualizing frame can be found by clicking on the Visualize icon on the main frame. A new frame opens:
There you can find the two counterparts Attacker and Target. The Attacker is the local host where the ATK is running. The Target is the as target specified host. The colored sub-boxes show detailed info about the systems. These are:
All data elements are textboxes. So you are able to click on them, select the text and copy it to the clipboard. Now you are able to use the data in an external application (e.g. text editor) for further analysis.
If you are not really interested how the information exchange is graphically visualized, you are able to change to the listing view in the tab. The whole communication is now provided as a simple list but the same data can be found:
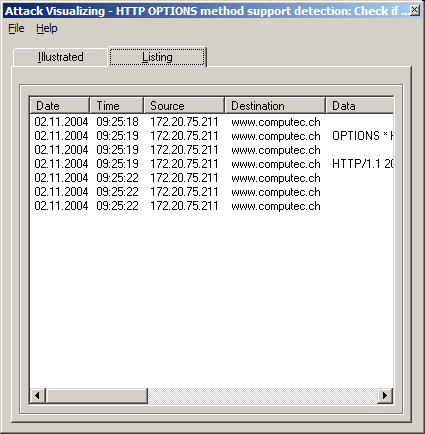
Every entry is shown in a separated line and the data fields are written in different columns. Additionally the last column show a description of the action that was taken. This information is also written on the title of the frame.
The Attack Visualizing is given in real-time. You are able to open this frame, run your attack and see the data exchange as it is. If you close the Attack Visualizing the recorded data is flushed. This means you are not able get the data after closing the frame. A recording and reply function is planned in a further release.